2024 Energy Infrastructure Sector Outlook
The energy infrastructure sector operates assets that provide essential services needed to expand the global economy and maintain energy security. The sector is supported by stable cash flows, high barriers to entry, long-lived real assets and inelastic demand that led to double-digit returns in 2023.1
Energy infrastructure companies should continue to provide essential services for decades to come. Our 2024 outlook for the sector includes the following:
• A total return expectation for the energy infrastructure sector between 10% - 14%
• Growth in U.S. natural gas and oil production volumes setting new records
• Expanded U.S. role as the world’s largest exporter of energy in the world
• Projected oil and natural gas prices that promote further economic growth
We expect the energy infrastructure sector to deliver a total return between 10% - 14% in 2024. The chart below illustrates the drivers including: a dividend yield between 6%-7%, forecasted dividend growth of 3% - 5% and stock buybacks of 1% - 2%.
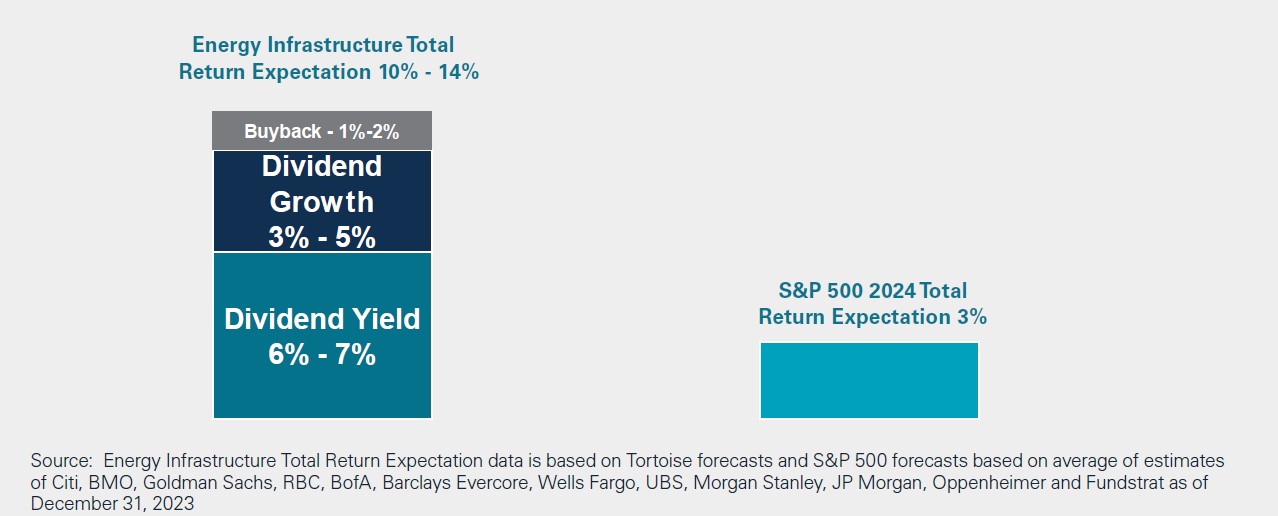
Energy Infrastructure expected returns are estimates for the sector as a whole and are not representative of any Tortoise product or strategy. Future results will vary.
The total return expectation for the energy infrastructure sector compares favorably to the average total return expected for the S&P 500 by the major Wall Street banks. In fact, from December 31, 2020 to December 31, 2023, the energy infrastructure sector, as represented by the Alerian Midstream Energy Index, delivered a 25% annualized return compared to 10% for the S&P 500 Index. The 2024 total return expectation would extend this streak of good absolute and relative returns.
Why has the energy infrastructure sector outperformed? The main driver has been the fundamental shift in capital allocation by energy company management teams. To put it in perspective, in 2021, most energy infrastructure companies pivoted their focus to free cash flow generation after more than a decade of focus on growth. Investors have rewarded the sector for this and we expect this discipline to carry-over to 2024.
Can this performance streak continue? As we look ahead, we expect that capital discipline will continue to produce compelling free cash flow yields. As highlighted in the chart below, the free cash flow yield generated by energy infrastructure stocks is double the free cash flow yield generated by S&P 500 companies. In addition, we expect interest rates to fall in 2024. With that decline, we believe that bond and stock investors will be searching for current income investment alternatives. The dividend yield of the energy infrastructure sector is four times higher than the dividend yield of the S&P 500. Lastly, the energy infrastructure sector still trades at a discount to historical norms based on traditional valuation metrics such as enterprise value-to-EBITDA.
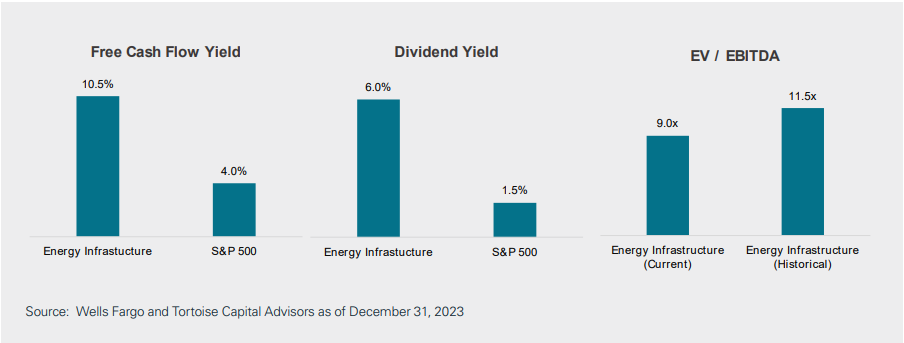
The combination of high current income allocated from steady free cash flow in a sector that trades at a discount to historical norms and to the S&P 500 sets the stage for energy infrastructure sector outperformance and another year of double-digit returns for investors.
Record setting U.S. oil and natural gas production
U.S. oil and natural gas production grew in 2023 setting new all-time highs. Energy infrastructure companies operate millions of miles of pipelines and other infrastructure assets that distribute millions of barrels and billions of cubic feet of energy every day. The U.S. energy infrastructure network is as essential to the daily economy as the circulatory system is to the human body for daily living.
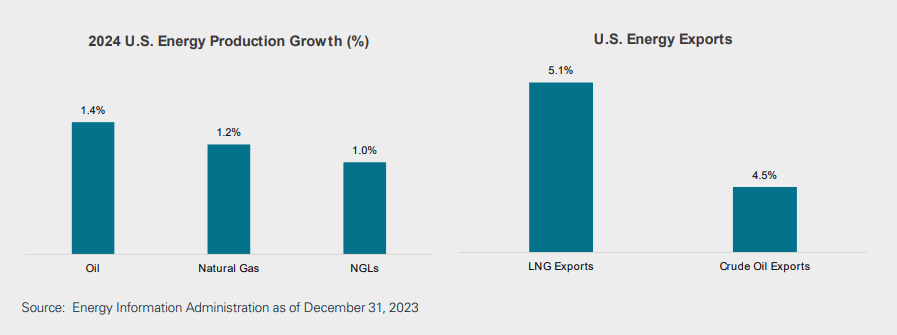
In 2024, we expect U.S. oil and natural gas production to set new records growing by 1.4% and 1.2% as shown in the chart on the next page. In addition, we believe that natural gas liquids (NGLs) that are turned into propane, ethane, butane, isobutane, as well as natural gasoline will also rise to record setting levels. Energy infrastructure companies primarily generate cash flow from volume growth, so increased U.S. oil and gas production will be a catalyst for higher cash flow for the pipelines and related infrastructure operated by the companies in the energy infrastructure sector.
The primary source of U.S. oil and gas production growth is the U.S. shale industry. Oil and natural gas produced from shale is one of the most significant technological advancements that has positively impacted the energy sector over the past two decades. According to the EIA, U.S. natural gas produced from shale represents 79% of the daily U.S. natural gas production, while crude oil produced from shale represented 66% of total U.S. production.
Why has U.S. shale technology been so impactful? U.S. shale has kept commodity prices lower for longer helping tame inflation and spur global economic growth. Today, U.S. crude oil prices are $5 lower than the global Brent benchmark and natural gas prices in Europe and Asia are more than three times higher than prices in the U.S. (as of January 12, 2023). Lastly, U.S. electricity prices are almost three times less than those in the U.K., Italy, and Germany. This cost advantage (due to U.S. shale’s ability to deliver low-cost energy) will be beneficial as manufacturing and industrial activity returns to the U.S.
Rising U.S. energy exports
Increased U.S. shale production has driven a rise in U.S. energy exports. Currently, U.S. energy exports exceed $300 billion in value, representing over 15% of total U.S. exports. As noted in the chart above, U.S. oil exports and LNG exports are both forecasted to rise by 5% in 2024.
The U.S. is the largest exporter of energy because it offers low cost, low carbon, and reliable energy supply to many countries around the world. The chart below illustrates the rise in U.S. energy exports since 2010. The rise in U.S. exports of NGLs, crude oil, and liquefied natural gas (LNG) corresponds with the timing of the U.S. shale revolution.
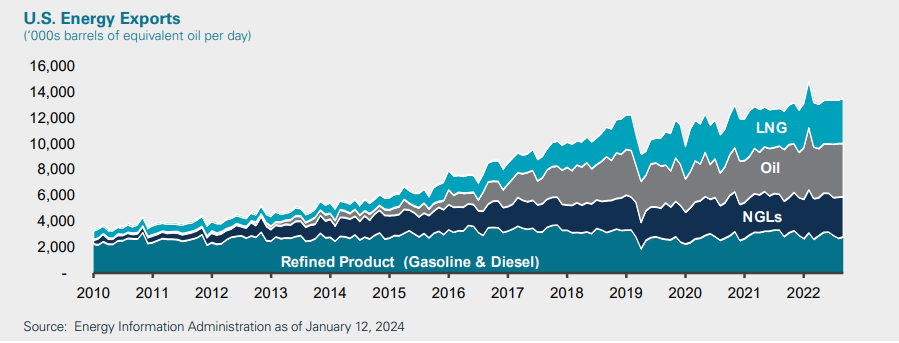
As the largest exporter of refined products in the world, the U.S. exports approximately 3 million barrels per day (mm b/d) which is about 16% of daily refined production volumes. The U.S. exports refined products (primarily gasoline and diesel fuel) to over 200 countries. The largest customers are Mexico, Canada and India. U.S. refiners maintain a global cost advantage, so we expect future growth of U.S. refined product exports.
The U.S. is also the largest producer and exporter of NGLs in the world. NGLs are mostly comprised of propane, ethane and butane, but also include isobutane and natural gas gasoline. The U.S. exports over 2.5 mm b/d representing 41% of U.S. natural gas liquids production. Propane and ethane are the predominant NGLs that are exported to over 160 countries with the almost half of the exports going to Japan, China, India and South Korea. U.S. propane exports to Asia are driven by increasing demand for propylene that is a raw material used to manufacture plastics. India has steadily increased its propane use as the government promotes increased use of propane to replace wood or charcoal to improve the quality of life and reduce carbon emissions in India.
Since the U.S. Congress repealed the ban on crude oil exports in 2015, daily exports have increased by 10 times! Today, the U.S. is the largest producer of crude oil in the world and is the fifth-largest oil exporter in the world exporting over 4 mm b/d. In 2024, a majority of the growth in crude oil production is forecasted to be exported so exports will likely rise by 5%. The U.S. exports approximately 30% of the oil it producers to 74 countries with the largest volumes of exports going to the Netherlands, China and South Korea. Recently, the U.S. has increased its exports of crude oil to the Netherlands to replace oil previously supplied by Russia.
Exports of LNG have emerged as a clear source of long-term growth potential for the U.S. energy sector. Natural gas imports were growing until the development of U.S. shale reshaped the global natural gas supply map turning the U.S. into a natural gas exporter. Since 2010, U.S. natural gas exports have increased by over 6 times equivalent to 17 billion cubic feet per day (bcf/d), roughly the 2023 production volume of the entire Haynesville Shale field. The U.S. has become the largest exporter of LNG in the world. When Russia invaded Ukraine in 2022, the U.S. prevented an energy catastrophe in Europe by increasing U.S. LNG exports to Europe. Demand for U.S. LNG is forecasted to rise by 5% this year alone.
Currently, the U.S. exports to 42 countries with over 50% of LNG exports going to Europe. LNG exports represent around 13% of total U.S. gas supply.
To support growing LNG supply, infrastructure that converts LNG back to natural gas, also known as regasification, is being constructed around the world. Over the past 10 years, global LNG import capacity has grown by 49%. Germany, Philippines and Vietnam imported LNG for the first time in 2023. By the end of 2024, 55 countries will have LNG regasification terminals with a combined capacity of 163 bcf/d. The EIA forecasts global LNG import capacity is set to expand by 16% or 23 bcf/d by the end of 2024 compared with 2022. LNG regasification capacity in Europe is expanding by 33% by the end of 2024 compared to 2022. Asia is adding almost 12 bcf/d of capacity in 2023 and 2024 while Europe is adding 9 bcf/d representing 90% of the regasification growth.
Commodity prices
Oil, natural gas and related natural gas liquids remain the primary sources of the global energy supply. They are forecasted to be critical energy supply sources for multiple decades. A lack of investment in the development of new oil and gas supply sources coupled with growing global energy demand that reached record levels in 2023 leaves little margin for error for the suppliers of global energy.
U.S. oil and natural gas prices fell by 8% and 25%, respectively in 2023. The next chart highlights the commodity futures curve for U.S. oil and natural gas prices projected over the next 12 months.
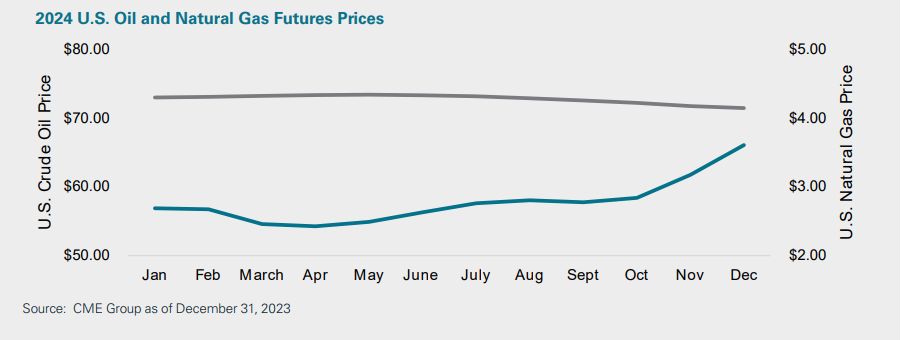
Oil prices are projected to remain flat at approximately $70 per barrel for the remainder of the year.
Three factors that may cause spot prices and the forward curve to shift up or down include:
1. Global economic growth - global Gross Domestic Product growth of over 2% results in record setting global oil demand in 2024. We expected global oil demand to rise by 1-2% or 1 – 2 mm b/d.
2. OPEC+ announced 2.2 mm b/d of voluntary production cuts through the first quarter of 2024. The first quarter is typically the lowest quarter for oil demand and the oil market is typically oversupplied to start the year. Full compliance with the cuts will result in an under supplied oil market causing oil inventories to decline, which generally results in higher oil prices.
3. Geopolitical risks - There are multiple ongoing conflicts across the Middle East and Ukraine that could impact the global oil supply. An escalation or de-escalation in these conflicts will impact oil fundamentals and pricing dynamics. We think the current oil prices do not reflect a geopolitical risk premium based on the several potential supply
disruptions.
Based on all of these factors, we expect U.S. crude oil prices to trade around $80 per barrel in 2024.
U.S. natural gas prices declined by 25% in 2023 and began the year with inventories 10% higher than normal. As a result, the weather over the first few months of 2024 will likely be the most influential driver of the direction of natural gas prices. A polar vortex or Winter Storm Uri-like event could quickly reduce U.S. and/or European natural gas inventory levels which would likely result in a temporary spike in natural gas prices to near $5 per thousand cubic feet (mcf). Typical winter weather across North America and Europe appears to be reflected appropriately in the future curve as natural gas prices will likely remain around $2.50 per mcf for the foreseeable future. A warmer than normal winter would result in a high natural gas surplus resulting in prices falling below $2.50 per mcf. Of course, lower natural gas prices are a nice gift to U.S. consumers as the average U.S. natural gas price from November 1, 2022 – March 31, 2023 was $4.52 per mcf so home heating bills are projected to decline this winter compared to last.
Demand for energy is fairly inelastic resulting in steady cash flows for energy infrastructure companies. Therefore, small changes in commodity prices don’t materially impact cash flows, but movements in short and long-term commodity prices can impact overall sentiment related to the investing the energy sector.
Conclusion and key takeaways
Energy infrastructure companies operate assets that provide essential services resulting in stable cash flows, high barriers to entry, long-lived real assets, and inelastic demand. In 2024, we believe that the shift toward capital discipline and free cash flow generation will extend the sector’s streak of double-digit returns. Oil and natural gas will maintain and will potentially increase market share representing the most critical global energy supply sources. The U.S. has become the largest energy producer in the world because of the oil and gas produced from shale. The U.S. is expected to expand its role as the world’s largest energy exporter due to its low supply cost and high degree of reliability. Energy infrastructure companies play an essential role in the delivery of domestic and global energy and will benefit from growing U.S. energy production and an elevated role for the U.S. in the global energy sector.
1 Based on the Alerian Midstream Energy Index which returned 14.02% and the Alerian MLP Index which returned 26.56% for 2023.
Disclosures
The information in this piece reflects TCA views and opinions as of date herein which are subject to change at any time based on market and other conditions. This commentary contains certain statements that may include “forward-looking statements.” All statements, other than statements of historical fact, included herein are “forward-looking statements.” Although Tortoise believes that the expectations reflected in these forward-looking statements are reasonable, they do involve assumptions, risks and uncertainties, and these expectations may prove to be incorrect, Actual events could differ materially from those anticipated in these forward-looking statements as a result of a variety of factors. You should not place undue reliance on these forward-looking statements, which speak only as of the date of this publication. Tortoise does not assume a duty to update these forward-looking statements. The views and opinions in this commentary are as of the date of publication and are subject to change. This material should not be relied upon as investment or tax advice and is not intended to predict or depict performance of any investment. This publication is provided for information only and shall not constitute an offer to sell or a solicitation of an offer to buy any securities.
Past performance is no guarantee of future results. It is not possible to invest directly in an index.
The Alerian Midstream Energy Index is a broad-based composite of North American energy infrastructure companies. The capped, float-adjusted, capitalization-weighted index, whose constituents earn the majority of their cash flow from midstream activities involving energy commodities, is disseminated real-time on a price return basis (AMNA) and on a total-return basis (AMNAX). The Alerian MLP Index is the leading gauge of energy infrastructure master limited partnerships (MLPs). The capped, float-adjusted, capitalization-weighted index, whose constituents earn the majority of their cash flow from midstream activities involving energy commodities, is disseminated real-time on a price-return basis (AMZ) and on a total-return basis (AMZX). The S&P 500® Index, an unmanaged market-value weighted index of stocks that is widely regarded as the standard for measuring large-cap U.S. stock market performance.
Earnings Before Interest, Taxes, Depreciation and Amortization (EBITDA) is a non-GAAP measure used to provide an approximation of a company’s profitability. This measure excludes the potential distortion that accounting and financing rules April have on a company’s earnings; therefore, EBITDA is a useful tool when comparing companies that incur large amounts of depreciation expense because it excludes these non-cash items which could understate the company’s true performance. Free Cash Flow is the cash a company produces through its operations, less the cost of total capital expenditures (growth and maintenance).


2024 Energy Outlook