Energy infrastructure (EI) stocks, as represented by the Alerian Midstream Energy Index, delivered an impressive 16% total return in the first half of 2024 surpassing the S&P 500 Index. Investors likely have been drawn to the sector’s high free cash flow, attractive dividend yields, and its essential role in energy supply resulting in appreciation in the sector.
H2 2024 Outlook
Several key factors we expect to further bolster the energy infrastructure sector in the second half of 2024:
- Increasing Long-Term Global Energy Demand: As global energy demand continues to rise, we believe the energy infrastructure sector is positioned for steady growth to meet this demand.
- U.S. Leadership in Energy Exports: The U.S. has solidified its position as the world’s largest energy exporter. This expanding role is expected to drive continued growth in energy infrastructure investments and operations.
- Rising U.S. Oil and Natural Gas Production: Projections indicate that U.S. oil and natural gas production will increase through 2025, necessitating robust energy infrastructure needed to manage and transport these resources efficiently.
- Artificial Intelligence (AI) Development and Energy Infrastructure: The critical role of energy infrastructure in supporting AI development has become increasingly evident. AI’s need for reliable, continuous energy underscores the indispensable nature of energy infrastructure in technological advancements.
The intertwined relationship between AI and energy infrastructure highlights a fundamental reality: there can be no AI advancements without EI! As AI and other technological innovations gain momentum, the importance of energy infrastructure should become even more critical, driving growth and appreciation in this sector.
We believe investors can expect these key fundamentals to continue propelling the energy infrastructure sector forward, presenting a compelling investment opportunity for the foreseeable future.
Total Return Potential Over the Next 12 Months
We anticipate that the energy infrastructure sector will deliver a total return between 10% and 15% over the next twelve months. The chart below illustrates the key drivers including a dividend yield between 6% and7%, forecasted dividend growth of 3% to 5% and stock buybacks of 1% to 2%.
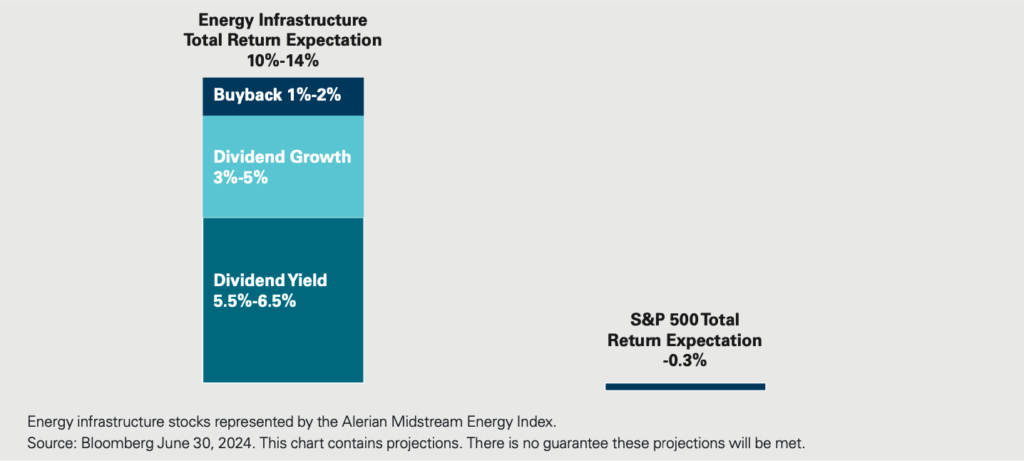
In contrast, the S&P 500 Index closed on June 28, 2024, at 5,460. Based on estimates provided by Goldman Sachs, RBC, BofA, Barlcays, Evercore, Wells Fargo, UBS, Morgan Stanley, JP Morgan, Citi, Oppenheimer, and Fundstrat, the average target for the S&P 500 is 5,442 representing a 0.3% decline. Consequently, the total return expectation for the energy infrastructure sector is more favorable compared to the average total return expected for the S&P 500 by major Wall Street banks.
Several key fundamentals are expected to bolster the energy infrastructure sector including:
Increasing Long-Term Global Energy Demand
The recent release of the 73rd edition of the Statistic Review of World Energy highlighted that global energy demand grew for the 38th time in the last 40 years in 2023. As illustrated in the chart below, global energy demand growth has increased by a compound annual growth rate of 2% since 1983.

Projecting forward, we expect global gross domestic product (GDP) growth to continue at a rate of around 3%. Additionally, we anticipate that global energy demand will maintain its high correlation with global GDP growth, resulting in new demand records set annually.
Over the past 40 years fossil fuels – including crude oil, natural gas, and coal – have accounted for more than 80% of the global energy supply.1 Looking forward, we expect these fossil fuels to continue supplying more than 80% of the world’s energy, although the specific mix will likely shift to more natural gas and less coal.
U.S. Expanding Role as Largest Energy Exporter in the World
Since 2010, the U.S. has significantly expanded its role as a global energy exporter. Leveraging advancements in shale technology, the U.S. has transitioned from being a net energy importer to becoming a net energy exporter. Today, the U.S. holds the title of the world’s largest energy exporter. The chart below illustrates the growth in U.S. energy exports of refined products, natural gas liquids (NGLS), oil, and liquified natural gas (LNG). Recently, the U.S. surpassed Qatar as the largest world exporter of LNG.
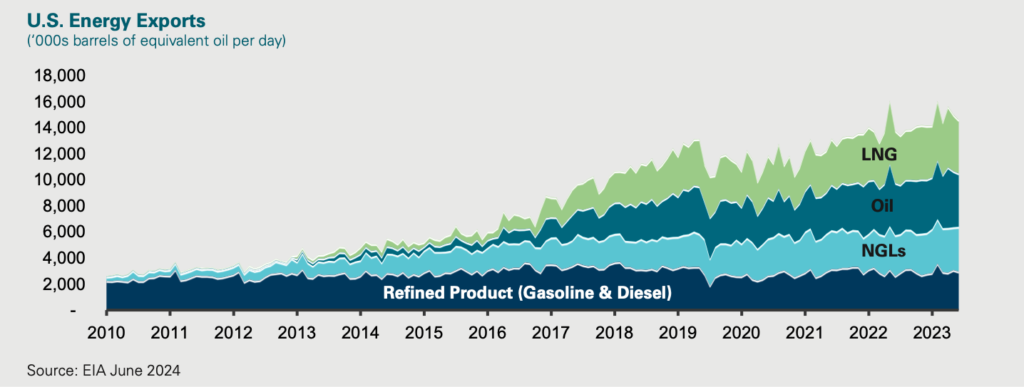
Year-over-year through April 2024, U.S. exports of crude oil and refined products have increased by 5% while NGLs exports have risen by 9%.2 Although U.S. LNG exports have temporarily stalled due to delays in the completion of the latest LNG facility, we anticipate a return to growth in 2025. The delay of Exxon’s Golden Pass LNG facility until 2025 has impacted short-term export growth, but the long-term outlook remains positive.
We believe that U.S. energy exports will continue to rise at steady rates, supported by the world’s largest energy infrastructure network. In our view, the continued expansion and enhancement of this infrastructure will be critical in maintaining the U.S.’s position as a leading global energy exporter and meeting the increasing global demand for energy.
U.S. Oil and Gas Production Growing into 2025
The U.S. is the largest producer of oil and gas in the world and is expected to maintain this role, with forecasts predicting increased production volumes through 2025. The chart below highlights the growth rates in U.S. oil and natural gas production, as well as electricity consumption for 2024 and 2025.
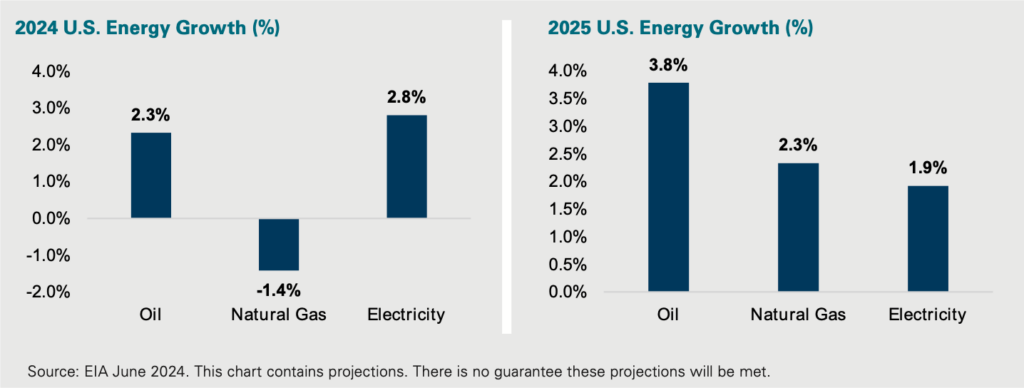
U.S. oil production is forecasted to steadily grow by 300,000 to 500,000 barrels per day, translating to an annual growth rate of 2% to 4% in both 2024 and 2025. Due to the delay in the LNG facility mentioned earlier and lower natural gas prices, U.S. natural gas production is anticipated to decline in 2024 before rebounding and growing by over 2% in 2025.2
Additionally, we’ve included U.S. electricity consumption growth in the chart, as it is becoming an important variable impacting our future energy outlook. U.S. electricity consumption is predicted to grow by approximately 2% to 3% in 2024 and 2025. This growth rate is not driven entirely by residential electricity usage, which is forecasted to grow between 1% and 2%.2 Instead, electricity consumption growth is likely increased by rising manufacturing and industrial activity, possibly including the early impacts of artificial intelligence (AI).
AI: an Emerging Growth Catalyst for the Energy Sector
The long-term potential for AI and its rapid pace of development were underscored in the first half of the year with industry leaders like Nvidia CEO Jensen Huang suggesting that AI could represent the fourth industrial revolution. While AI has long been a growth catalyst for the technology sector, it is now emerging as a significant growth driver for the energy sector as the essential nature of AI infrastructure becomes evident. AI requires continuous, steady electricity 24 hours a day 7 days a week, prompting electricity providers to prepare for a surge in demand related to AI development.
A case in point is Dominion Energy, the electricity provider for Northern Virginia, known as “Data Center Alley” due to its high concentration of data centers. The chart below highlights Dominion’s 2020 filing with Virginia regulatory authorities. It forecasted peak load growth of around 1% per year through 2030. However, in its most recent regulatory filing, Dominion now forecasts over 6% annual load growth through 2030. The key driver of this change is the rapid expansion of data centers in Northern Virginia and across the U.S.
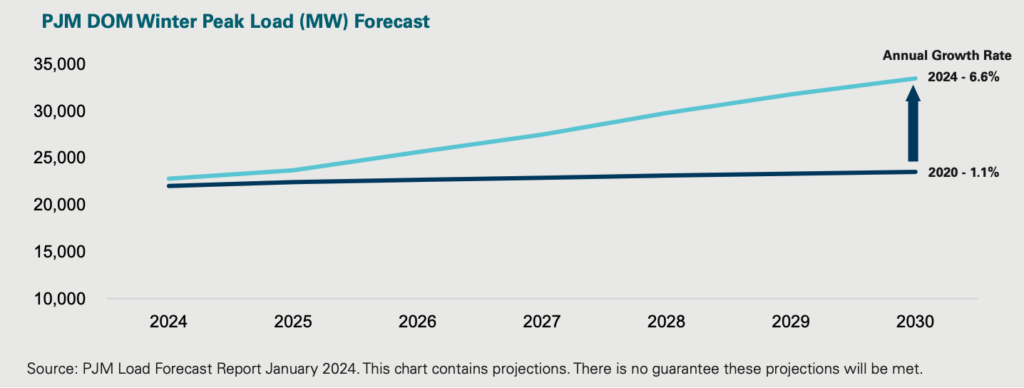
The growth in the number and size of data centers, coupled with the increasing power requirements of AI technologies, is ushering in a new era of growth in U.S. electricity demand. The chart above highlights a potential inflection point in 2026 in northern Virginia when the rate of change in electricity demand is expected to accelerate significantly.
As AI technology continues to evolve, its impact on the energy sector should become increasingly pronounced. The need for reliable, continuous power to support AI infrastructure should drive substantial growth in electricity consumption, creating new opportunities and challenges for energy providers.
Natural Gas is Expected to Fuel the AI Boom
Natural gas is the leading energy source for electricity generation, constituting 43% of the supply in 2023 so it should experience growth as electricity demand increases.2 Maintaining a continuous and reliable electricity is crucial for uninterrupted data center operations. While renewable energy sources such as solar and wind have gained traction in recent years due to their environmental benefits, they do present challenges in terms of intermittency. In our view, natural gas is seen as the most reliable and lowest cost option to fuel the AI boom. Nuclear power generation is another reliable option but the last nuclear power plant that came into service in May of 2024 was seven years behind schedule and cost $30 billion which is more than twice the original budget so nuclear is a reliable option but not a low cost one. So, the surge in natural gas demand to support increased electricity consumption presents an avenue for growth.
The chart below illustrates the drivers behind a potential 30% increase in U.S. natural gas production by 2030.
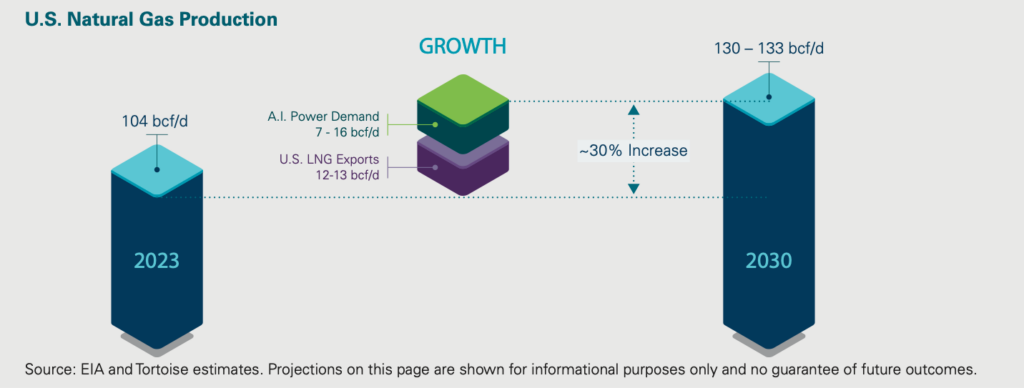
Even before the emergence of AI as a potential catalyst for growth, the U.S. natural gas sector was already poised for expansion, largely driven by projected increases in LNG exports through 2030. U.S. LNG exports are forecasted to double from current levels, with an estimated growth of 12 to 13 billion cubic feet per day by 2030.3 Natural gas to fuel the AI boom could result in a demand increase ranging from 7 to 16 billion cubic feet per day. When considering both sources of growth, U.S. natural gas production could witness a substantial uptick, potentially rising by nearly 30% by 2030. This heightened demand stresses the necessity for expanded production capabilities and the augmentation of critical natural gas infrastructure to accommodate the anticipated surge in volume.
Valuation: What is Priced into Energy Infrastructure Stocks?
Given the strong fundamental background and the potential of AI as a long-term catalyst for the energy sector, a common question arises: how much of these factors are already reflected in current valuations? The bar charts below illustrate valuation metrics such as enterprise value (EV) to earnings before interest, taxes, depreciation, and amortization (EBITDA) compared to historical norms, as well as free cash flow yield and dividend yield for the energy infrastructure sector relative to the S&P 500 Index.
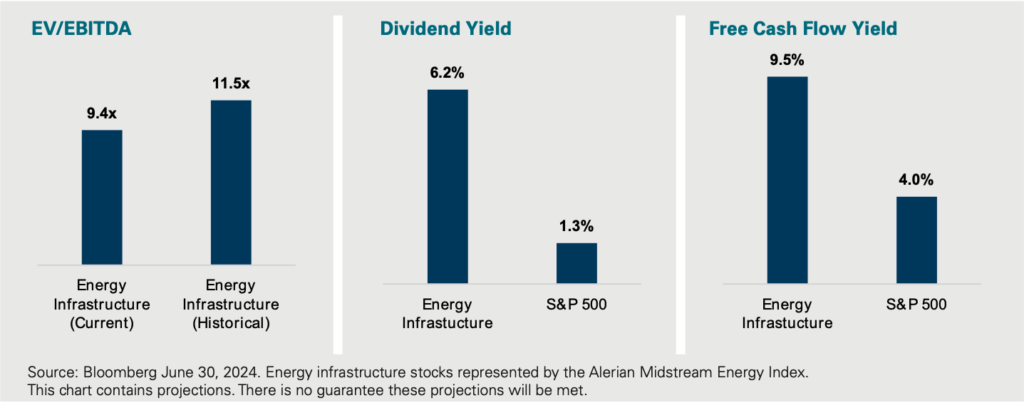
The energy infrastructure sector stands out as one of the few sectors with stocks that are not trading at or above historical valuation metrics. For instance, the sector is currently trading around 9x EBITDA, compared to a historical average of 11.5x. This indicates that, despite strong fundamentals, the sector remains undervalued relative to its historical norms.
Furthermore, the energy infrastructure sector boasts some of the highest free cash flow yields across the stock market. With a free cash flow yield of nearly 10%, the sector’s yield is more than twice that of the S&P 500. This high free cash flow yield underscores the sector’s strong cash generation capabilities, which can be used to increase dividends, reduce debt, and/or buyback stock.
In addition to attractive free cash flow yields, we believe the dividend yields offered by the energy infrastructure sector are compelling. As of June 30, 2024, the sector’s dividend yield exceeds 6%, which is almost five times higher than the S&P 500’s dividend yield. Moreover, energy infrastructure stocks offer the potential for dividend growth of 3% to 5% annually, providing investors with a combination of high current income and potential for income growth.
Supportive Commodity Prices
Before wrapping up our outlook, let’s briefly touch on recent trends in commodity prices and their implications for the energy infrastructure sector.
During the first half of 2024, oil prices saw a significant increase of 14%, while natural gas prices remained relatively unchanged. Since the beginning of the year, the futures curve for oil prices has risen by approximately 11%, with expectations that oil prices will average $80 per barrel for the remainder of the year.4 In contrast, due to a warm winter leading to high natural gas inventories, the natural gas futures curve has declined by an average of 5%, with prices expected to average $2.85 per million cubic feet (mcf) for the rest of the year.
One of the most interesting developments in the commodities market this year is captured in the chart below. The correlation between movements in oil prices and energy infrastructure stocks has declined to 0.27, roughly half of the correlation observed in prior years.

This decoupling is a refreshing indication that energy infrastructure stock performance is becoming less dependent on fluctuations in oil prices and more focused on company fundamentals. This trend can be attributed to the fee-based nature of energy infrastructure companies, which ensures a low correlation between operational cash flow and oil price movements.
Summary: Energy Infrastructure Stocks – A Compelling Investment Opportunity for 2024 and Beyond
Energy infrastructure stocks have had a strong start in 2024, and the fundamentals and technical indicators suggest that this momentum will continue. Energy infrastructure companies manage assets that provide essential services, historically resulting in stable cash flows, high barriers to entry, long-lived real assets, and inelastic demand. We believe these characteristics make energy infrastructure a resilient and attractive investment.
Several key factors are poised to drive further growth in the sector:
- Increased Global Energy Demand: As global energy demand continues to rise, energy infrastructure should play a critical role in meeting this demand, ensuring steady growth for the sector.
- Increased U.S. Energy Exports: The U.S. has emerged as the world’s largest energy exporter. This expanding role is expected to drive continued growth in energy infrastructure investments and operations.
- Higher Oil and Gas Production: U.S. oil and natural gas production is forecasted to increase through 2025, necessitating efficient infrastructure to handle and transport these resources.
- AI Development as the Fourth Industrial Revolution: The critical role of energy infrastructure in supporting AI development has become increasingly evident. AI requires reliable, continuous energy, making energy infrastructure indispensable for technological advancements.
Interestingly, the stock prices of energy infrastructure companies have become disconnected from movements in oil prices. We believe investors have been increasingly recognizing the fundamental drivers of growth for the sector, which include stable cash flows from essential services and high free cash flow yields.
Despite these positive factors, energy infrastructure stocks still trade at discounts to historical levels, enhancing their investment appeal. We believe high dividend yields and free cash flow, which provide significant current income and potential for dividend growth from long-lived, essential assets, are attractive to investors.4
In summary, energy infrastructure stocks have the potential to offer:
- High Dividend and Free Cash Flow Yields: Providing substantial current income.
- Long-Lived Real Assets: Featuring large economic moats and essential services.
- Attractive Valuations: Trading below historical averages, presenting a compelling investment opportunity.
In our view, these attributes make the energy infrastructure sector a compelling option for current and future investors,
offering stability, growth, and attractive returns.
1 Source: Energy Institute Statistical Review of World Energy, 73rd Edition, June 2024
2 Source: EIA, June 2024
3 Source: Tortoise and EIA, June 2024
4 Source: Bloomberg
Disclosures
The information in this piece reflects TCA views and opinions as of date herein which are subject to change at any time based on market and other conditions. This commentary contains certain statements that may include “forward-looking statements.” All statements, other than statements of historical fact, included herein are “forward-looking statements.” Although Tortoise believes that the expectations reflected in these forward-looking statements are reasonable, they do involve assumptions, risks and uncertainties, and these expectations may prove to be incorrect, Actual events could differ materially from those anticipated in these forward-looking statements as a result of a variety of factors. You should not place undue reliance on these forward-looking statements, which speak only as of the date of this publication. Tortoise does not assume a duty to update these forward-looking statements. The views and opinions in this commentary are as of the date of publication and are subject to change. This material should not be relied upon as investment or tax advice and is not intended to predict or depict performance of any investment. This publication is provided for information only and shall not constitute an offer to sell or a solicitation of an offer to buy any securities. This publication cites information from other sources. While we believe such information to be accurate, we do not warrant to the accurateness of such information.
Past performance is no guarantee of future results. It is not possible to invest directly in an index.
The Alerian Midstream Energy Index is a broad-based composite of North American energy infrastructure companies. The capped, float-adjusted, capitalization-weighted index, whose constituents earn the majority of their cash flow from midstream activities involving energy commodities, is disseminated real-time on a price return basis (AMNA) and on a total-return basis (AMNAX). The S&P 500® Index, an unmanaged market-value weighted index of stocks that is widely regarded as the standard for measuring large-cap U.S. stock market performance.
Earnings Before Interest, Taxes, Depreciation and Amortization (EBITDA) is a non-GAAP measure used to provide an approximation of a company’s profitability. This measure excludes the potential distortion that accounting and financing rules April have on a company’s earnings; therefore, EBITDA is a useful tool when comparing companies that incur large amounts of depreciation expense because it excludes these non-cash items which could understate the company’s true performance. Free Cash Flow is the cash a company produces through its operations, less the cost of total capital expenditures (growth and maintenance). Liquefied Natural Gas (LNG) is a natural gas that has been cooled to a liquid state for shipping and storage – the volume in this state is about 600 times smaller than in its gaseous state, able to transport for much longer distances when pipeline transport is not feasible. Enterprise value (EV) measures a company’s total value, often used as a more comprehensive alternative to market capitalization. EV includes in its calculation not only the market capitalization of a company but also short-term and long-term debt and any cash or cash equivalents on the company’s balance sheet.