


A Midstream Megadeal, Implications, and Fallout for Investors
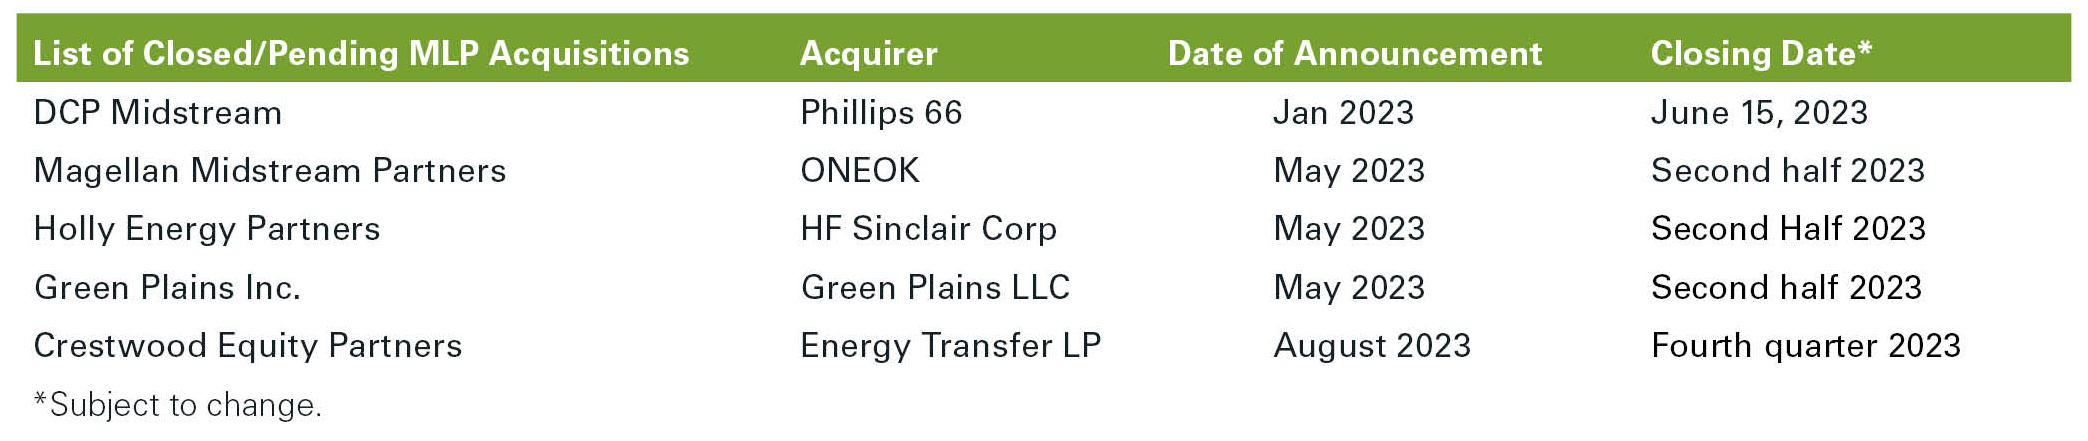
On May 15th, ONEOK (OKE) and Magellan Midstream Partners (MMP) agreed to a deal merging the Tulsa-based firms. A shareholder vote is expected in the back half of 2023 and would create one of the largest pro-forma energy infrastructure entities. We believe the current deal spread based on ONEOK and Magellan Midstream Partners stock prices implies that the deal is more likely than not to be approved and close in 2023.
On August 16th, Energy Transfer LP (ET) announced it entered an agreement to acquire Crestwood Equity Partners (CEQP). The all equity transaction is tax-efficient for CEQP unitholders. This agreement is subject to a vote of CEQP unitholders expected in the fourth quarter of 2023.
The ramifications of these potential transactions are wide-ranging. We first wrote about midstream M&A implications in June 2023. In an update to our first writeup, we cover macro takeaways, specifically the continued move away from MLPs towards C-Corps.
In the video below, Mark Marifian explains deal, its implications and fallout for investors
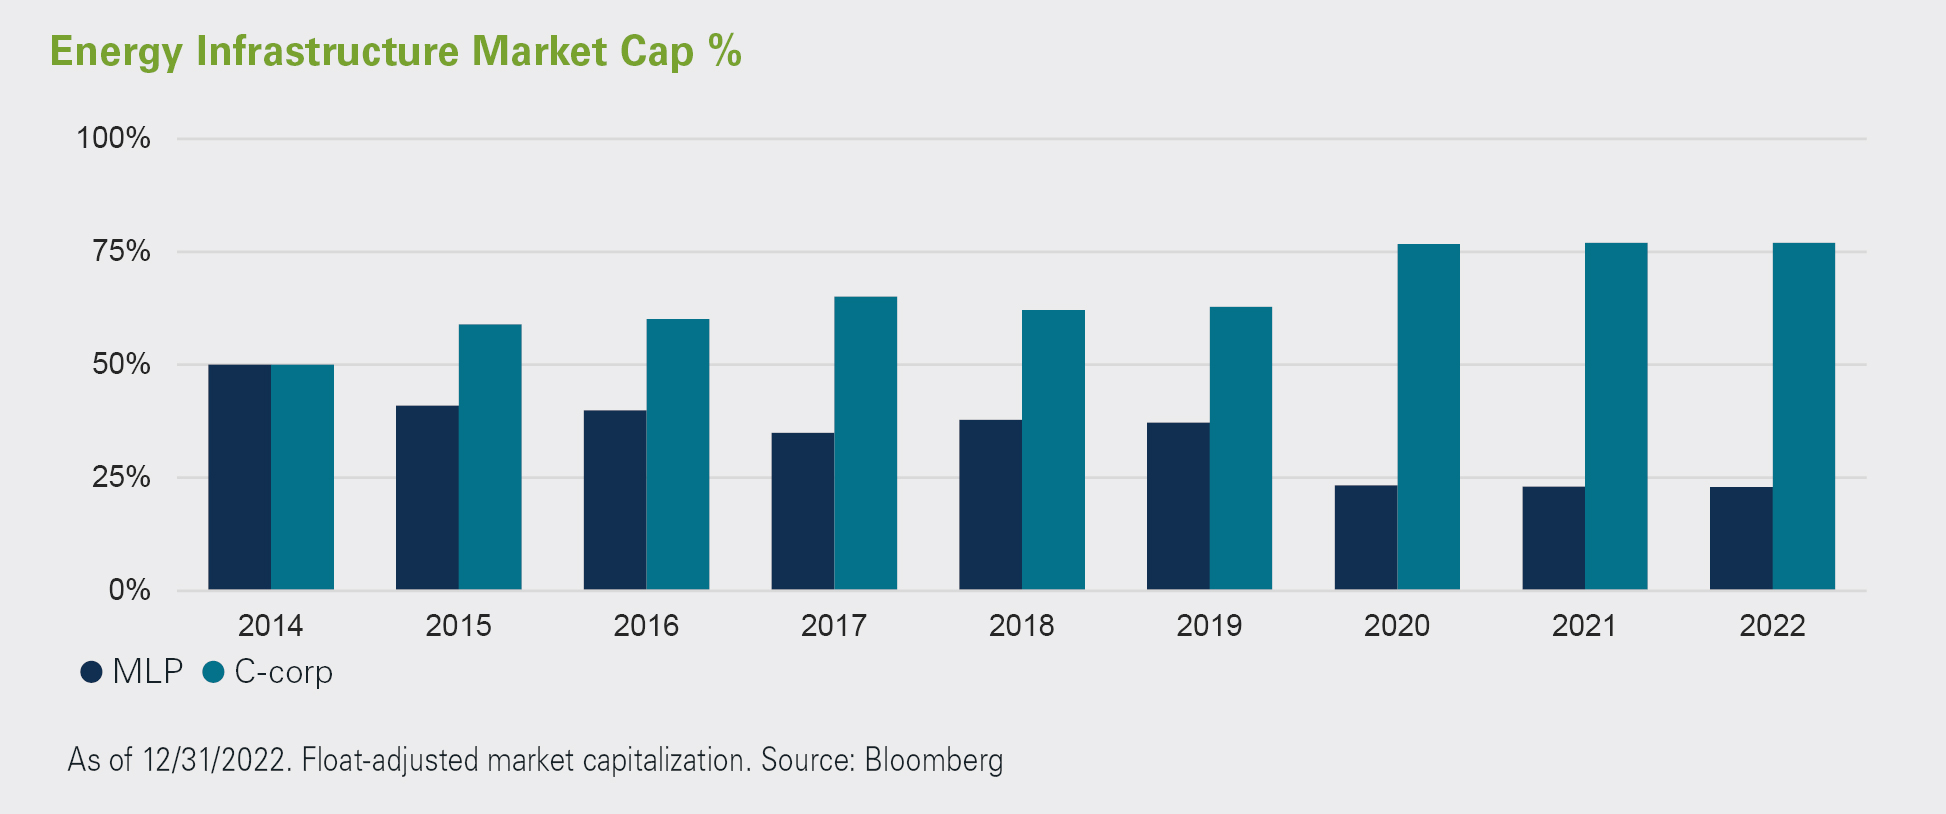
The MLP consolidation trend has increased in 2023, and it is now becoming increasingly difficult to achieve a diversified MLP only portfolio.
The diversion of market cap between MLPs and C-Corps continues to widen through simplifications and consolidations of MLPs. The chart below shows how on a percentage basis the float-adjusted market cap between C-Corps and MLPs shifted from 50/50 in 2014 to 77/23 at the end of 2022.
At the end of 2022, Alerian MLP Infrastructure Index (AMZI) constituents, which consist of midstream MLPs, had a market cap of $210 billion and a float adjusted market cap of only $112 billion. The Tortoise North American Pipeline IndexSM (TNAP), which consists of MLPs and C-Corps had a market cap of $624 billion and a float adjusted market cap of $501 billion. The $501 billion is almost 5x the market cap of MLPs! This ratio will only be further exacerbated by the pending MLP acquisitions.
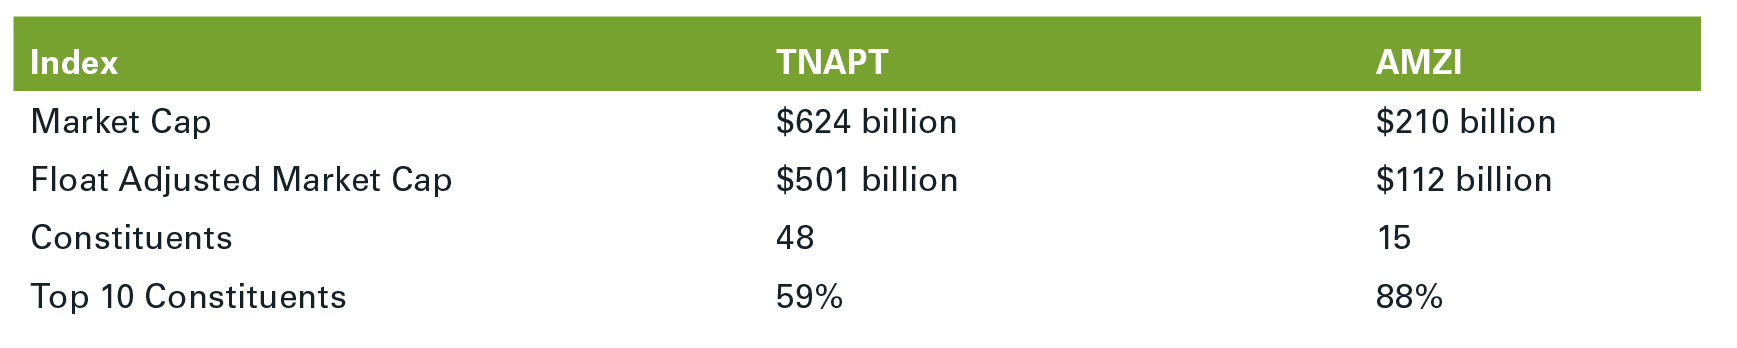
In fact, should the four pending transactions close, the number of constituents in the AMZI would fall to just 11. Given the trend of MLPs being acquired over the past decade, have energy infrastructure investment products realigned their investment strategies to reflect a narrower opportunity for MLPs?
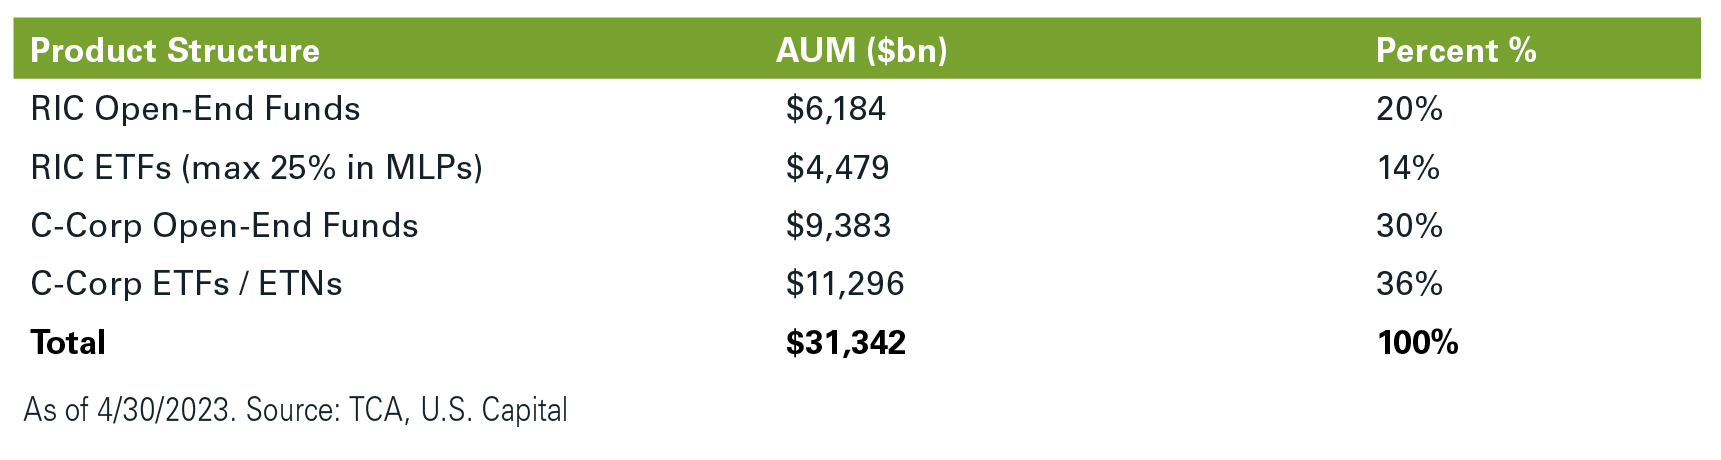
We believe a mismatch remains. Of the $32.4 billion in structured products, just $11.5 billion (34%) of the energy infrastructure investment product is in regulated investment company (RIC) structured funds. The remaining 66% of energy infrastructure product is in C-Corp structured funds or exchange-traded notes (ETNs) which track MLP-focused indices. Again, that is opposite of the market cap of companies in the universe! While some C-Corp funds may own non-MLP holdings, C-Corp funds are predominantly invested in the narrow subset of MLPs remaining today.
With a narrower universe comes the possibility for tax consequences, additional volatility, less liquidity and potential tracking error for C-Corp Funds.
For Magellan shareholders, the proposed merger is a taxable event. In slides released by the company, Magellan disclosed that 35% of shareholders have held the stock for 5 years or longer. MLP deals can involve tax consequences, specifically around recapture. MLP investments have two components that impact unitholders – first, instead of distributions being subject to tax when they are paid, the investor defers the taxes until the units are sold. Second, each year unitholders receive their share of the MLP’s income or loss (which includes depreciation deductions) that gets included in the investors overall taxable income calculation. Therefore, upon sale, the government “recaptures” or “recharacterizes” capital gain to ordinary gain and the shareholder pays the previously deferred taxes. This highlights a potential risk for MLP unitholders and C-Corp investment products which invest predominantly MLPs.
One final wrinkle is taxation at the fund level. Despite a scenario where recapture occurs, C-Corp funds are subject to tax at the fund level if there is taxable income, which includes income or loss passed-through from MLP’s RIC structured funds are by definition pass-through structures, own less than 25% in MLPs, and therefore are not subject to a tax at the fund level.
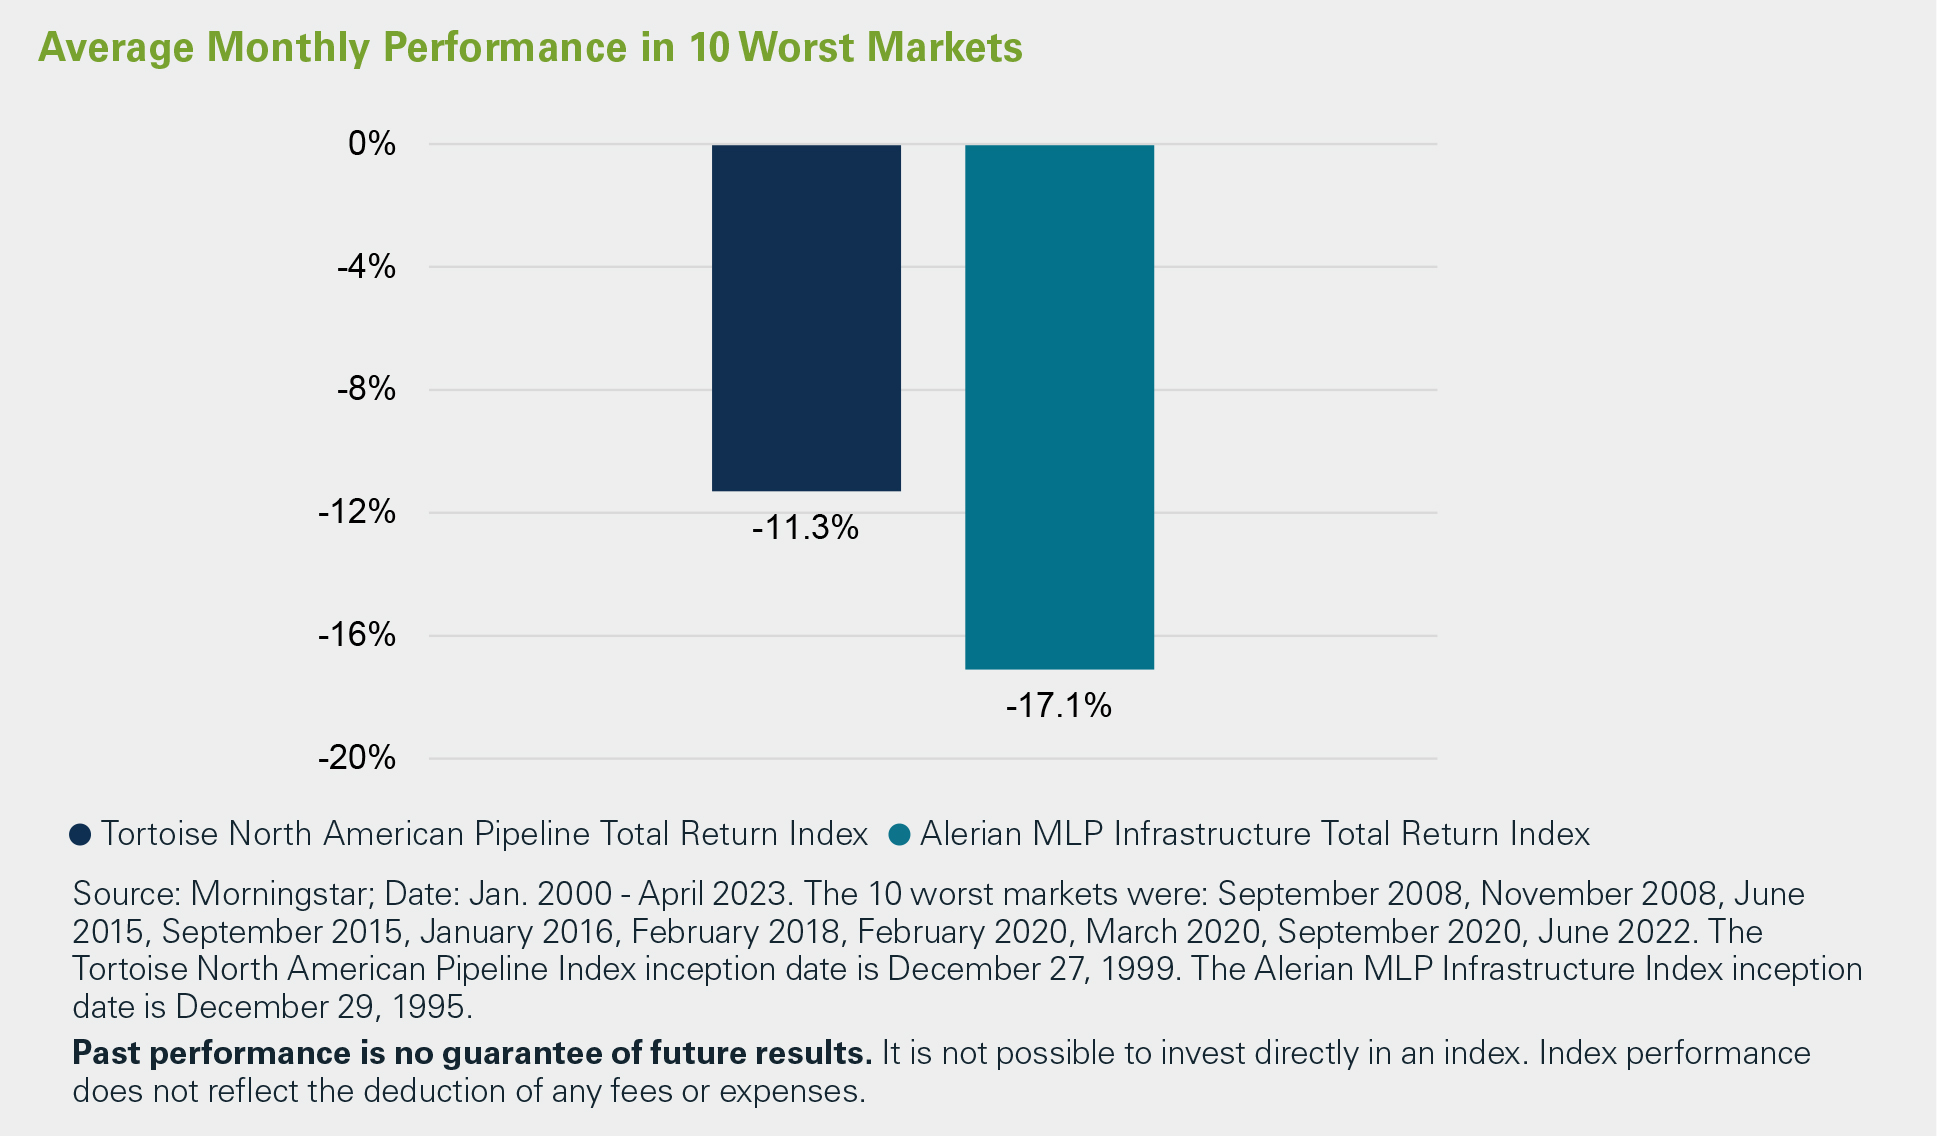
The concentration risk of an MLP only portfolio is particularly evident during down months, as shown below. The Tortoise North American Pipeline Index which represents the broad pipeline space, has 0.66 of the downside capture of the MLP only Alerian MLP Infrastructure Index.
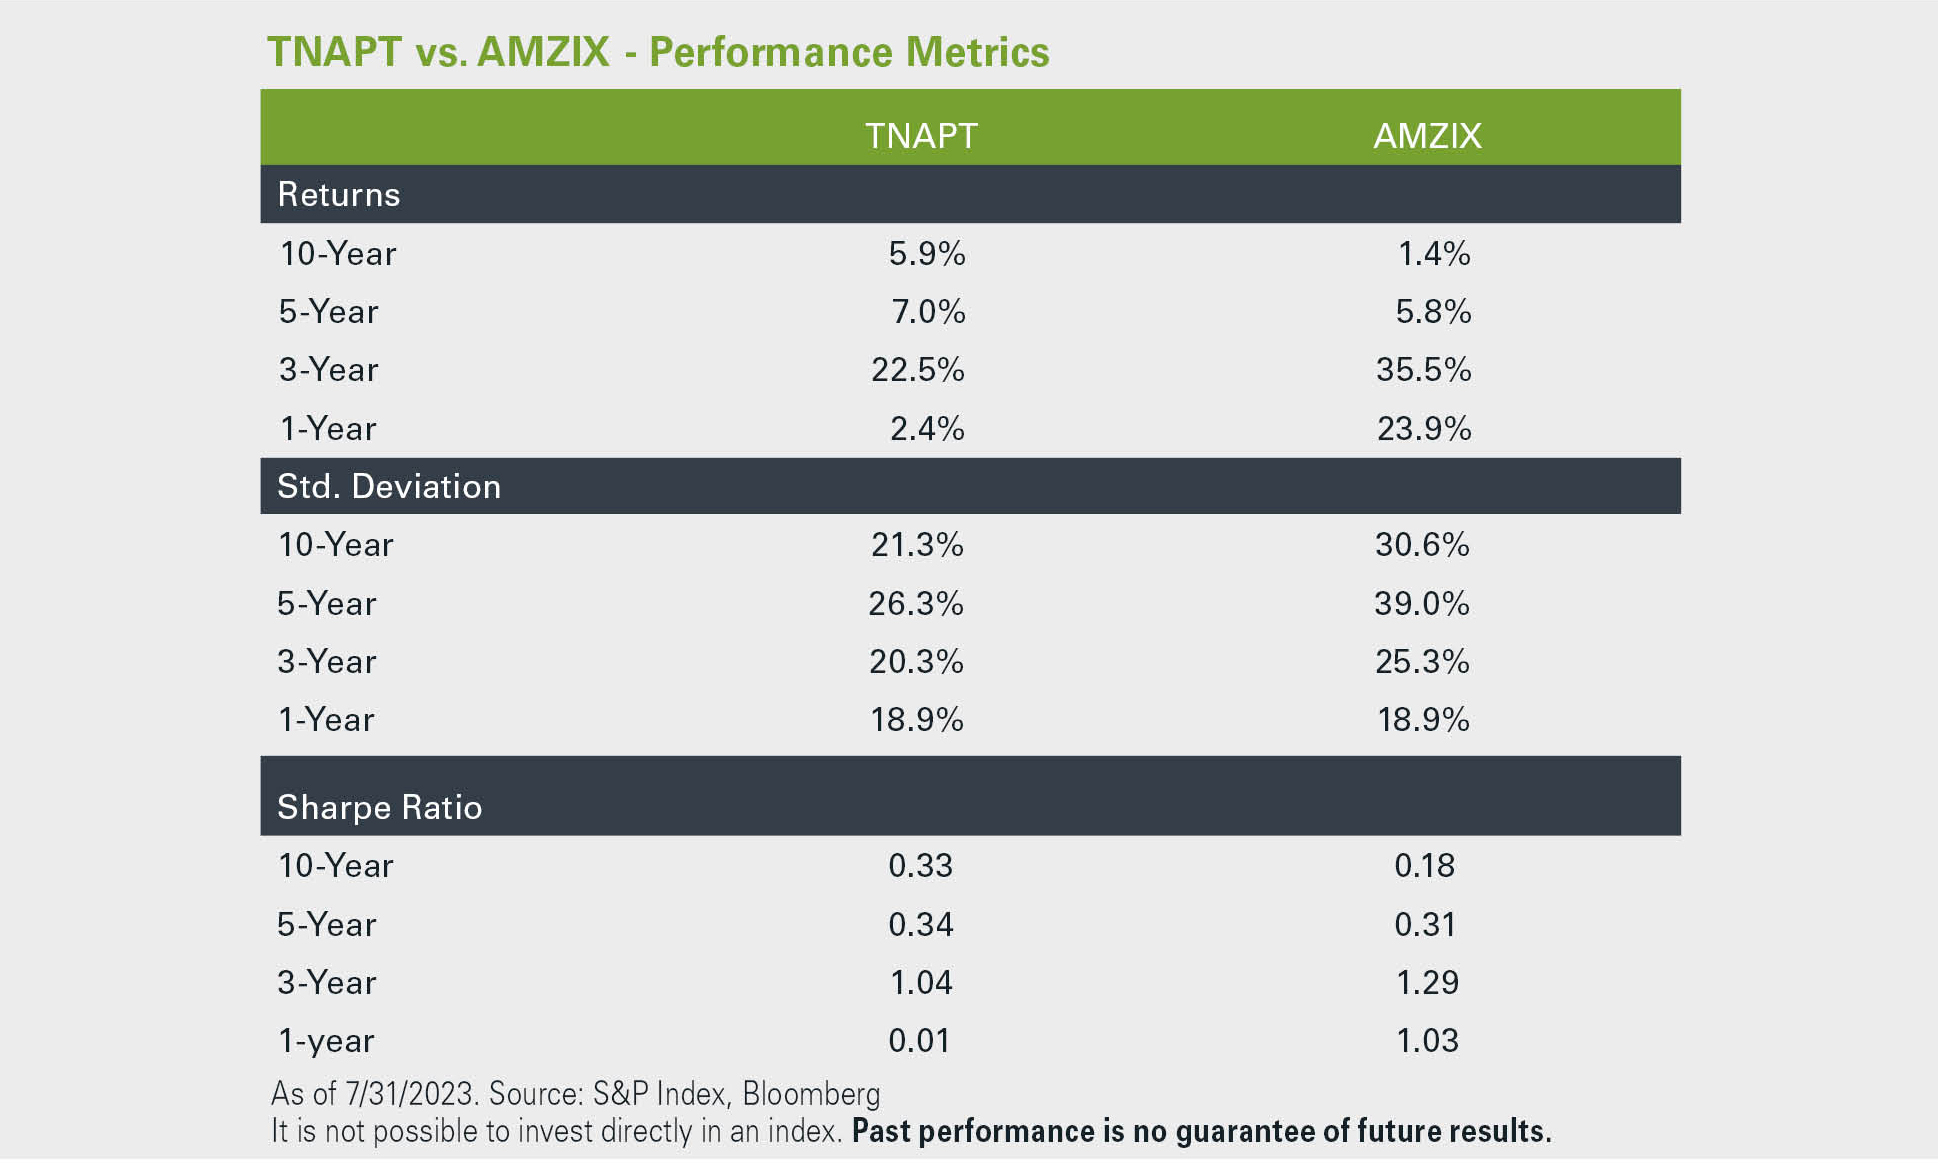
In addition to the benefits provided by a larger and more diversified universe, midstream indices with a broader strategy have historically provided better returns, lower volatility and thus better risk-adjusted returns.
A quick assessment of asset class liquidity emphasizes the narrow size of MLPs within the broader midstream sector. The 2022 average daily trading $ volume for AMZI Index constituents was $705 million or less than 1% of the float adjust market cap. However, that liquidity is severely skewed towards the larger, more liquid MLPs. The six largest AMZI Index constituents represented $584 million (82%) of the $705 million in 2022 average daily trading $ volume. As larger constituents leave, smaller MLPs may become a larger allocation in MLP focused investment products. Less liquidity can be more difficult to trade and create excess volatility for investors. With nearly $10 billion concentrated in passively managed MLP products alone, money coming out could easily create a liquidity event.
Despite underperformance in the short term, we believe the movement away from MLPs presents investors an opportunity to align their portfolios with the broader opportunity set for the sector. In addition to the benefits provided by a larger and more diversified universe, midstream portfolios with a broader strategy historically provided better returns, lower volatility, and thus better risk-adjusted returns.
The characteristics provided for the index are illustrative of the characteristics of an asset class and are not indicative of the performance of any investment product. The historical data of the index prior to its inception date was calculated on the same basis on which the index is currently calculated. Past characteristics are no guarantee of future results. It is not possible to invest directly in an index. Index performance does not reflect the deduction of any fees or expenses.
This data is provided for informational purposes only and is not intended for trading purposes. This document shall not constitute an offering of any security, product or service. The addition, removal or inclusion of a security in the index is not a recommendation to buy, sell or hold that security, nor is it investment advice. The information contained in this document is current as of the publication date. TIS Advisors makes no representations with respect to the accuracy or completeness of these materials and will not accept responsibility for damages, direct or indirect, resulting from an error or omission in this document. The methodology involves rebalancing and maintenance of the index that is made periodically during each year and may not, therefore, reflect real time information.
The Tortoise North American Pipeline IndexSM (the “Index”) is the exclusive property of TIS Advisors, which has contracted with S&P Opco, LLC (a subsidiary of S&P Dow Jones Indices LLC) to calculate and maintain the Index. The Index is not sponsored by S&P Dow Jones Indices or its affiliates or its third party licensors (collectively, “S&P Dow Jones Indices”). S&P Dow Jones Indices will not be liable for any errors or omission in calculating the Index. “Calculated by S&P Dow Jones Indices” and its related stylized mark(s) are service marks of S&P Dow Jones Indices and have been licensed for use by TIS Advisors and its affiliates. S&P® is a registered trademark of Standard & Poor’s Financial Services LLC (“SPFS”), and Dow Jones® is a registered trademark of Dow Jones Trademark Holdings LLC (“Dow Jones”). No portion of this publication may be reproduced in any format or by any means including electronically or mechanically, by photocopying, or by any other form or manner whatsoever, without the prior written consent of Tortoise.
The Alerian MLP Infrastructure Index is a composite of energy infrastructure Master Limited Partnerships (MLPs). The capped, float-adjusted, capitalization-weighted index, whose constituents earn the majority of their cash flow from midstream activities involving energy commodities, is disseminated real-time on a price-return basis (AMZI) and on a total-return basis (AMZIX). AMZIX Index rules are available on vettafi.com. TNAPT Index rules are available on tortoiseecofin.com.
Standard deviation is a measure of the dispersion of a set of data from its mean. The more spread apart the data, the higher the deviation. Standard deviation is calculated as the square root of variance and is used by investors as a gauge for the amount of expected volatility. Sharpe ratio measures risk-adjusted performance. It is calculated by subtracting the risk-free rate from the rate of return for a portfolio and dividing the result by the standard deviation of the portfolio returns. The greater a portfolio’s Sharpe ratio, the better its risk-adjusted performance has been.
For additional information on TNAP, please call 844-TR-INDEX (844-874-6339) or visit www.TortoiseEcofin.com.
For more information on AMZ or AMZI, visit www.alerian.com.
It is not possible to invest directly in an index.
A Midstream Megadeal, Implications, and Fallout for Investors